Item & Skin Trading Simulator

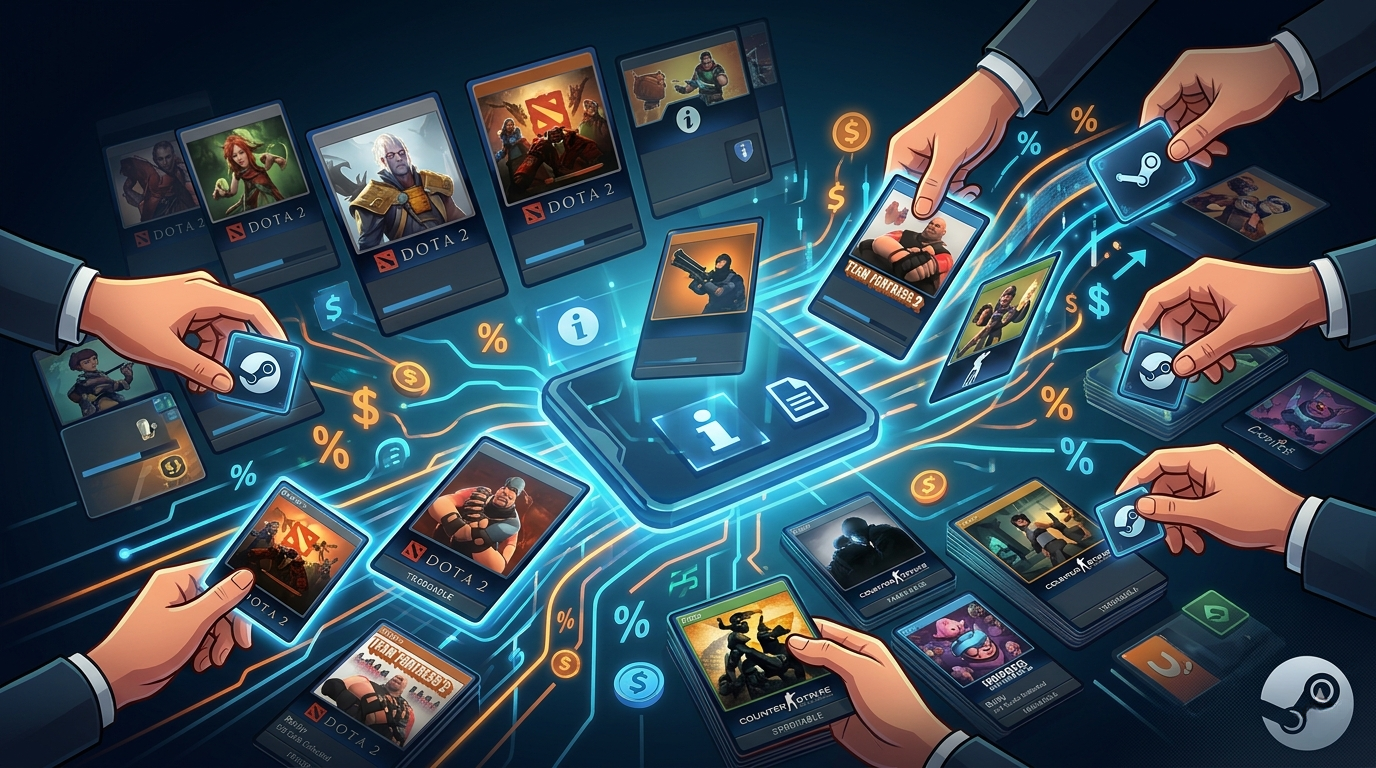
Explore item & skin trading scenarios, compare venues and fees, and forecast profit for CS2 and Dota 2 skins.

Trading Simulator
Step 1 of 5

Choose your path:

How Profitable Is Item Trading? 2025 Guide to CS2 and Dota 2 Skins

Item trading in Counter-Strike 2 (CS2) and Dota 2 is the practice of buying and selling cosmetic items to capture small pricing edges. Professionals rotate capital across the Steam Community Market and third-party cash marketplaces, focusing on spread after fees, turnover speed, and event timing. This guide explains real-world profitability, the stats that matter, how often traders actually trade per day, and the risks that determine long-term outcomes.
Table of Contents

What Professional Item Trading Looks Like in 2025

Item trading at the pro or semi-pro level is an inventory rotation business. The trader's job is to:

  • Source items at prices that leave a net spread after all fees.
  • Move inventory quickly to compound small edges.
  • Time entries and exits around patches, cases, capsules, and majors.
  • Diversify venues so exits match goals. Steam wallet liquidity is not the same as cash marketplaces.
Edge comes from three habits: ruthless fee math, fast release of stuck inventory, and pre-planned event exposure.

Typical operating setup

  • Capital bands: from $500 to $2,500 for starters, $5,000 to $20,000 for serious traders, and $50,000+ for pros.
  • Venue mix: Steam Community Market for liquidity and discovery, third-party markets for cashing out and arbitrage.
  • Time commitment: 10 to 30 hours per week of monitoring and relisting in active periods.

The Four Profit Engines

Arbitrage Across Markets

Buy where an item is temporarily cheap and sell where demand is stronger. This works when:

  • The fee on the sell venue is meaningfully lower than Steam.
  • Cycle time is short so your annualized return is high.
  • You avoid reversal and hold pitfalls by planning logistics.
Arbitrage edges compress as tools spread. Treat it as opportunistic, not guaranteed.

Flipping Undervalued Listings

  • Scan high-volume items for mispriced listings. Reprice tightly and relist fast.
  • Great for knives, gloves, popular skins, and attractive floats.
  • Margins are thin. The win is in speed, not in massive spreads.

Event-Driven Bets

  • Position before majors, sticker capsules, or big patches.
  • When hype hits, liquidity spikes and exits are easier.
  • Risk is narrative whiplash. If the event underwhelms, you can be trapped in slow-bleed inventory.

Long-Term Scarcity Plays

  • Discontinued cases, classic skins, rare patterns, or prestige items with cultural staying power.
  • Lower frequency, larger potential payoffs.
  • Opportunity cost matters. Tie up too much capital and you starve your fast-turn engine.

Fees and Friction You Must Model

Fee Reality Check

Steam Community Market typically charges around 15% combined fee for CS2 and Dota 2. Proceeds are Steam Wallet credits, not cash.

Third-party markets vary. Many pros target low single-digit seller fees on cash venues for exits.

Each percentage point of fee drag is paid on the gross sale price, not the profit.

Takeaway: Plan gross spreads that comfortably clear all fees plus listing friction.

Fees By Venue

SteamCash Market ACash Market B0%5%10%15%15%10%5%

Exact numbers: Steam: 15%, Cash Market A: 10%, Cash Market B: 5%

Most beginners underestimate fees. The fastest way to improve profitability is to list where your net proceeds match your objective.

How Profitable Is Item Trading

The honest answer is that it depends on capital, turnover speed, hit rate, and regime. Below are illustrative ranges traders use for planning. These are not promises.

Starter Band: $500 to $2,500 of inventory

  • Focus: liquid mid-tier skins.
  • Cadence: 3 to 10 trades per day when active.
  • Net margin per winning cycle: roughly 0.5 to 2.0% after fees.
  • Outcome: learning months can be break-even. Disciplined months might net $100 to $500.

Serious Band: $5,000 to $20,000 of inventory

  • Focus: knives, gloves, high-demand skins, selective event bets.
  • Cadence: 5 to 20 trades per day when conditions are good.
  • Target: blended 1 to 3% net per effective cycle on a subset of inventory.
  • Illustrative month: rotate $10,000 through 15 effective cycles at 1.5% net equals about $2,250.

Pro Band: $50,000 to $200,000+

  • Focus: portfolio construction with a core of fast movers and a sleeve of swing bets.
  • Cadence: 10 to 30 trades per day in lively weeks, less in quiet regimes.
  • Target: blended 1 to 2% per cycle on larger capital with periodic event wins.
  • Illustrative month: $50,000 rotating with similar efficiency might produce $5,000 to $20,000 in strong conditions.

Profit Math Box

Net profit equals sum of realized spreads after fees minus losses minus operational costs.

Key levers you control: venue fees, turnover time, proportion of capital in fast vs event vs long-term, and discipline around cutting stale listings.

Item Trading Stats That Predict Success

  • Spread after fees by venue: the single most important number.
  • Turnover time: average hours or days from purchase to sale.
  • Hit rate: percentage of profitable trades.
  • Realized net per cycle: what you actually bank after fails and relists.
  • Event exposure: share of inventory tied to one narrative.
  • Venue mix: Steam wallet liquidity versus cash exits.
Track these as first-class metrics. What you measure improves.

How Often Do Item Traders Trade Per Day

There is no magic number, but real patterns look like this:

  • High-frequency mode: 10 to 20 trades per day while arbitrage and flip edges are present.
  • Baseline mode: 5 to 10 trades per day with periodic relisting and maintenance.
  • Event mode: fewer daily trades while you stage entries and batch exits.

What matters is not the count. It is whether the count reflects high-quality opportunities that clear fees and release capital on schedule.

Typical Holding Periods

  • Quick flips: 1 to 7 days depending on holds and listing dynamics.
  • Event or speculation: 1 to 3 months spanning capsule or patch windows.
  • Long-term scarcity: 6 to 12+ months with clear thesis and exit criteria.

Turnover Time vs Net Profit

1234560%5%10%15%Short-holdLong-holdMonthsNet Profit %
Data Table: Turnover Time vs Net Profit
MonthShort-hold StrategyLong-hold Strategy
13.5%2.0%
24.0%2.5%
34.5%3.5%
45.0%5.0%
55.2%7.5%
65.5%10.0%

Cycle-Time Tip

Shorter holding periods improve annualized return. A 1.2% net edge repeated 20 times beats a single 10% win that takes months.

Risk Management That Actually Saves Your P-and-L

  • Operational security: unique passwords, hardware 2FA, minimal third-party logins, careful device hygiene.
  • Venue risk: understand fee schedules, payout timings, and any trade holds or reversal policies.
  • Narrative risk: do not over-concentrate on one patch, case, or sticker story.
  • Liquidity risk: thin niches can strand inventory. Prefer a core book of liquid items.
  • Tax and record keeping: track cost basis, fees, and proceeds from day one.
Survival first. Profit next. The most profitable traders are usually the most boring operators.

Tooling Stack For Pros

  • Marketplaces: Steam Community Market for discovery and liquidity. Cash venues for exits where fees are lower.
  • Price comparison and alerts: watchlists and alerts on target items to spot temporary mispricings.
  • Analytics: a spreadsheet or dashboard that tracks spread after fees, time to sell, hit rate, and realized net by strategy.
  • Automation: light scripting for notifications and relist hygiene if your platform allows it.

Minimum Viable Dashboard

• Item name
• Buy price and venue
• Fees by venue
• Target sell price and venue
• Net spread after fees
• Date bought and date sold
• Holding time in days
• Notes on thesis or pattern

A Week In The Life Of A Pro Trader

Monday

Review weekend action. Update fee matrix and venue preferences per item class. Relist laggards tightly.

Tuesday to Wednesday

High-frequency window for flips and cross-venue gaps. Keep a live list of acceptable spreads and obey it.

Thursday

Event prep. Trim correlated exposure. Stage entries with alerts and staged exits.

Friday

Consolidate proceeds into the venue that best fits next week's plan. Do a post-mortem on turnover time and realized net.

Consistency comes from routines. Treat this like running a store, not chasing a lottery.

Strategy Mix

FlipsArbitrageEvent BetsLong-term

Flips: 35%

Arbitrage: 30%

Event Bets: 20%

Long-term Holds: 15%

Glossary For Fast Onboarding

Spread after fees: sale price minus all fees minus purchase price.
Turnover time: elapsed time from purchase to sale.
Event exposure: proportion of inventory reliant on a specific event.
Liquidity: how quickly you can exit at a fair price.
Cycle: one complete buy to sell loop.
Hit rate: percentage of cycles with positive net.

FAQ

How profitable is item trading?

In good regimes, disciplined traders target roughly 1 to 3% net per effective cycle on a rotating subset of inventory. Profit scales with speed and capital, not with any single trade.

What are the key stats?

Spread after fees, turnover time, hit rate, realized net per cycle, venue mix, and event exposure.

How often do pros trade per day?

Active weeks often show 5 to 20 trades per day. Quiet weeks focus on maintenance and planning.

Is Steam Community Market good for profit?

It is great for liquidity and discovery but fee heavy and pays wallet credits. Most pros use it strategically and exit for cash on third-party venues.

What about taxes?

Treat profits as taxable per your jurisdiction. Keep records of every buy, fee, and sale.

Conclusion

Item trading is a fee-sensitive, logistics-heavy business. The opportunity exists because skin markets are large and dynamic, but the edges are thin. Winning consistently requires:

  • Ruthless fee math per venue and item.
  • Fast turnover and disciplined relisting.
  • Planned exposure around events and patches.
Think like a merchant. Rotate inventory, protect capital, and let small edges compound.